
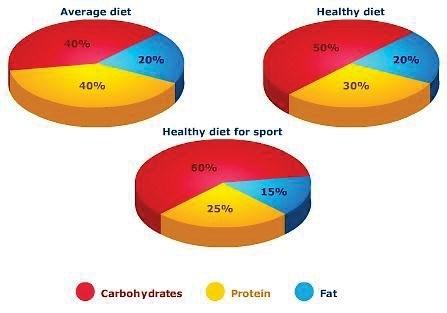
The pie chart illustrates the proportions of
carbohydrates
, protein and fat that average Use synonyms
food
, healthy diets and healthy diets for sports contain. Use synonyms
Overall
, the 2 types of healthy Linking Words
meals
include higher amounts of Use synonyms
carbohydrates
Use synonyms
whereas
the ratios of fat they have are relatively lower than the average.
Linking Words
According to
the chart, the proportions of 3 different nutrients vary depending on the kinds of Linking Words
meals
. Use synonyms
For example
, the average Linking Words
food
contains an equal amount of Use synonyms
carbohydrates
and protein. Use synonyms
In contrast
to them both accounting for 40%, the average meal contains fat with only 20%, which is only half of the other 2 nutrients.
Linking Words
While
there are no significant changes in the proportions of fat, healthy Linking Words
meals
contain more Use synonyms
carbohydrates
and less fat than normal Use synonyms
meals
. The proportion of Use synonyms
carbohydrates
is the largest in the healthy Use synonyms
food
for exercise with 60%. Use synonyms
In addition
, it includes the least amount of fat with 25%. It is Linking Words
also
interesting to note that half of the nutrients of healthy Linking Words
food
are comprised of Use synonyms
carbohydrates
. The rest is divided into protein and fat with 30% and 20% respectively.Use synonyms