the graph belows gives information about the percentage of the population in four asian countries living in cities from 1970 to 2020, with predictions for 2030 and 2040

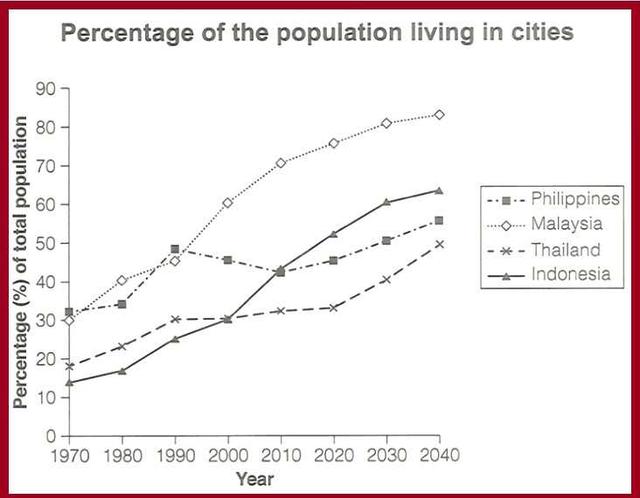
The given diagram provides statistical data about the proportions of the population in four different states living in urban areas between 1970 and 2020, with predictions from 2030 to 2040.
Overall
, all nations significantly rose in 2020. Malaysia experienced the largest increase, whilst the Philippines witnessed a slight fluctuation. The forecast of Malaysia will observe the most massive jump between 2030 and 2040 compared to the other remaining countries.
The Philippines had the highest figure in 1970, above 30%. It steadily increased in 1990 before fluctuating to below 50% in 2010 and jumping to roughly 46% in 2020. It is predicted to witness a massive strike to over 50% in 2040. Malaysia started with 30% in 1970 and it made a massive jump to reach above 70% in 2020, which is an all-time high and it will continuously rise for the next 20 years.
Indonesia and Thailand all began below 20% and dramatically grew to approximately 25% in 2000. Subsequently
, Indonesia diverged to be higher than 50% in 2020 and it is forecast to constantly escalate until 2040. Thailand remained steadily stable from 1990 until 2020, above 30% and it is expected to climb below 50% in 2040.Submitted by vonguyenkhai1234 on
Unauthorized use and/or duplication of this material without express and written permission from this site’s author and/or owner is strictly prohibited. Excerpts and links may be used, provided that full and clear credit is given to Writing9 with appropriate and specific direction to the original content.
Vocabulary: The word "increase" was used 2 times.
▼
Vocabulary: The word "jump" was used 2 times.
▼