The graph below gives information about how much people in the United States and the United Kingdom spend on petrol. Summarize the information by selecting and reporting the main features and make comparisons where relevant.

The graph below gives information about how much people in the United States and the United Kingdom spend on petrol.

Summarize the information by selecting and reporting the main features and make comparisons where relevant.
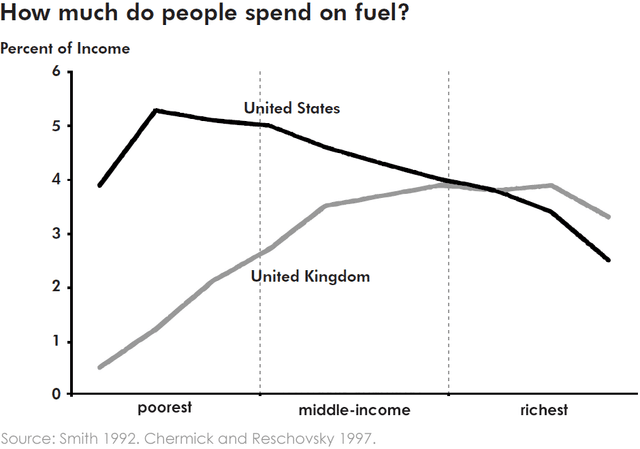
The line graph illustrates the spending of two countries, the United States and the United Kingdom, on gasoline.
Overall
, the
people
in the United States of America spend more compared to the citizens of the UK. The purchasing of the said two nations is of indirect proportion. In the UK, those
people
on the poorest level buy a lesser amount of petrol in comparison to the richest
people
. The poorest individuals in the UK spend 0.5% of their income on fuel.
While
the middle-income and highest earners use 3.5% and 4% respectively from their salary.
On the other hand
, in the US, those who are on below-average income spend more of their pay for fuel than those high-income earners. The poorest
people
spend 4% of their money on gasoline. But the middle-class and rich
people
are only spending 3.8% and 2.5%, respectively.
Submitted by eric.benedict520 on

Unauthorized use and/or duplication of this material without express and written permission from this site’s author and/or owner is strictly prohibited. Excerpts and links may be used, provided that full and clear credit is given to Writing9 with appropriate and specific direction to the original content.

Sentences: Add more complex sentences.
Common mistake: Your writing should be 150-250 words.
Basic structure: Change the fourth paragraph.
Vocabulary: Replace the words people with synonyms.
Vocabulary: Only 6 basic words for charts were used.
Vocabulary: Use several vocabularies to present the data in the fourth paragraph.
What to do next:
Look at other essays: