
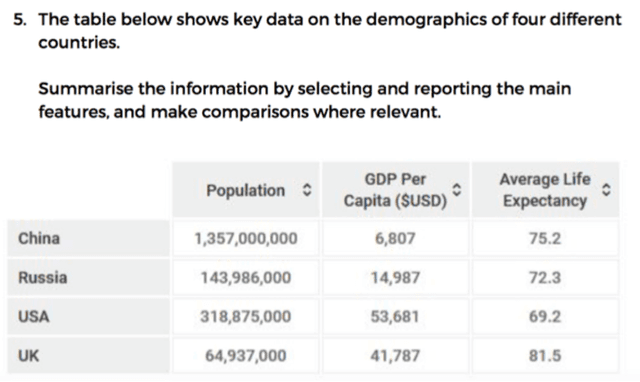
The table provides three important demographic information in China, Russia, the USA and the UK.
As can be seen from the chart, China had by far the greatest population, but its GDP was significantly lower compared to others, especially the USA’s which was the highest in the table. Meanwhile, the English on average lived the longest, which contrasted the Americans who had the shortest life expectancy.
To commence with, there were more than 1,3 billion people in China, followed closely by the USA (318 million), Russia (143 million) and the UK (64,9 million). When it comes to GDP, an American person made a tremendous amount of money over 53.000 dollars, which was approximately 12.000 dollars more than an English worker, and almost nine times that of a Chinese.
Surprisingly, when the average age is concerned, the UK people lived much longer than those in any other nation at 81.5 years. China’s life expectancy was slightly higher than that of Russia at 75.2 and 72.3 years respectively,
whereas
the Americans lived relatively shorter, at only 69.2 years.Linking Words