
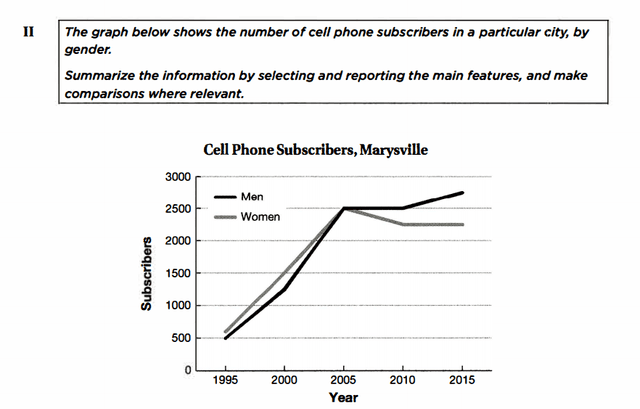
The line graph illustrates how many people used cell
phones
categorized by gender in Marysville during the period from 1995 to 2015.
Use synonyms
It is clear that
there was an upward tendency in the number of male and female users subscribed to cell Linking Words
phones
throughout the years. Use synonyms
Besides
, the figures for both men and women witnessed the most significant rise within the first decade.
As can be seen, there were 500 men using mobile Linking Words
phones
in 1995. Over the next 10 years, the sum of those kept increasing considerably and reached a high of 2500 subscribers. Use synonyms
However
, stability was experienced by male users until 2010 before peaking at 2725 in 2015.
Linking Words
Likewise
, more than 500 females owned Linking Words
phones
at the beginning of the observed time, Use synonyms
then
it soared noticeably to the same peak as males in 2005. Linking Words
Nevertheless
, the total of those decreased slightly to 2225 million in 2010 and stayed unchanged within the following 5 years.Linking Words