
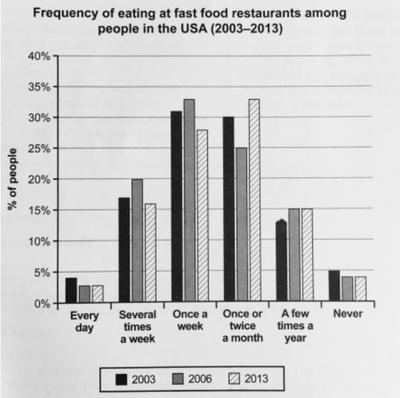
The data given in the chart illustrates the frequency based on fast-
food
consumption in the USA from 2003 to 2013.
Use synonyms
Overall
, most Linking Words
of
Change preposition
apply
people
in the USA consume fast Use synonyms
food
once a week for one decade. A part of Use synonyms
people
Use synonyms
also
went to fast Linking Words
food
restaurants once or twice a month. Use synonyms
However
, only a small portion of Linking Words
people
eat fast Use synonyms
food
every day and/or never consume it.
Most residents in the USA visited fast Use synonyms
food
restaurants once a week in 2003, 2006, and 2013 with approximately 31, 33, and 27 per cent respectively. Use synonyms
Although
in 2006 the percentage of once-a-week fast Linking Words
food
consumption was the highest amongst all categories, most citizens began to visit fast Use synonyms
food
once or twice a month in 2013.
Of the six categories, the frequency of Use synonyms
people
who ingest fast Use synonyms
food
every day is the smallest one, which never exceeded 5 per cent. Use synonyms
In addition
, only least than 6% never consumed fast Linking Words
food
. In terms of stopping by fast Use synonyms
food
eateries several times a week and a few times a year, the percentages vary between 10% and 20%.Use synonyms