
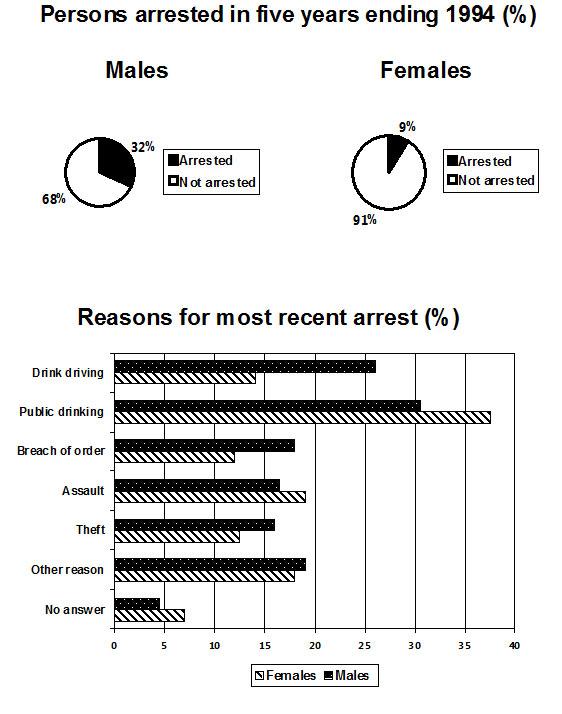
The two diagrams below present data on the proportion of males and females prosecuted from 1989-1994 and the latest factors for them, respectively.
Overall
, a larger sector of men Linking Words
have
gotten arrested during Change the verb form
has
this
period, in fact almost quadruple that of the women. Evidently, for both sexes, public drinking is the most popular cause of prosecution. On the other contrary, being arrested for no particular purpose is the least common for both genders.
Linking Words
To begin
with, women have been arrested for drinking publicly just below 40% of the time. Only 9% of females have been convicted of anything within those five years, though. Breach of order is the least often reported among the ladies. Linking Words
On the other hand
, assault is the Linking Words
second ranked
crime for Add a hyphen
second-ranked
this
gender.
Linking Words
Likewise
, males are not convicted of crimes wrongly most of the time. Linking Words
Conversely
, a third of the total males were arrested. Below public drinking, drunk driving is a prevalent issue among Linking Words
the
men, with approximately 25% of the causes of convictions being it. Correct article usage
apply
Moreover
, it is noteworthy that men surpass the other sex in breach of order by a substantial figure.Linking Words