
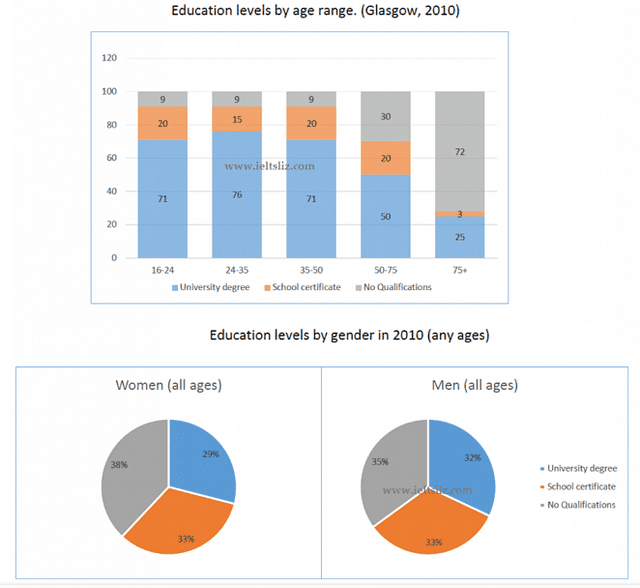
The provided chart illustrates a variety of education levels in Glasgow, in 2010. There are two pie charts, one of them shows different proportions of
women
's education levels, and another one represents Use synonyms
men
's education levels. what is obvious is, Scottish Use synonyms
men
are more educated than Use synonyms
women
.
speaking of details, 38% of females (all ages) don't have any qualifications Use synonyms
whereas
, Linking Words
this
part in females (all ages) is only 35%. Notable to mention that the majority of people with no qualifications are above 75 years old, Linking Words
on the other hand
, people under 50 years old had the lowest percentage of the whole. What is more, 29% of all Linking Words
women
had a university degree but Use synonyms
this
share in Linking Words
men
is 32%. Use synonyms
In addition
, it is worth saying that the first place in Linking Words
this
population is for 24 to 35 years old, Linking Words
then
35 to 50, and 16 - 24 shared the second place with each other.
Linking Words
To sum up
, it is evident from the statistics, Linking Words
men
are more willing to get higher educational degrees than Use synonyms
women
, and Use synonyms
this
is supported by figures.Linking Words