The table illustrates the financial funds that America, European and other countries allocated to developing ones from 2006 to 2010.

The table illustrates the financial funds that America, European and other countries allocated to developing ones from 2006 to 2010.
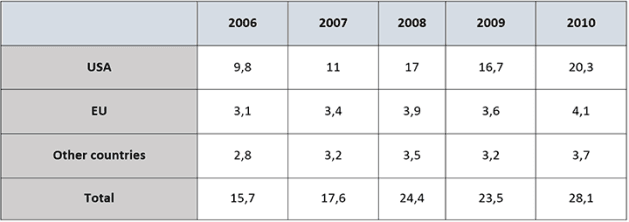
The table shows the number of employment in different countries like America, European and other countries from 2006 to 2010.
It is clear that
the number of employment in Asia is highest than in
others
Correct quantifier usage
other
show examples
countries in 2010 and the number of employment in Africa is lowest than in
others country
Fix the agreement mistake
other countries
show examples
.
First,
the table illustrates
Submitted by m on

Unauthorized use and/or duplication of this material without express and written permission from this site’s author and/or owner is strictly prohibited. Excerpts and links may be used, provided that full and clear credit is given to Writing9 with appropriate and specific direction to the original content.

Sentences: Add more complex sentences.
Basic structure: Write more paragraphs.
Basic structure: Add more body paragraphs.
Common mistake: Your writing should be 150-250 words.
Basic structure: Write more paragraphs.
Vocabulary: Only 4 basic words for charts were used.
Vocabulary: The word "table" was used 2 times.
Vocabulary: The word "number of" was used 3 times.
What to do next:
Look at other essays: