
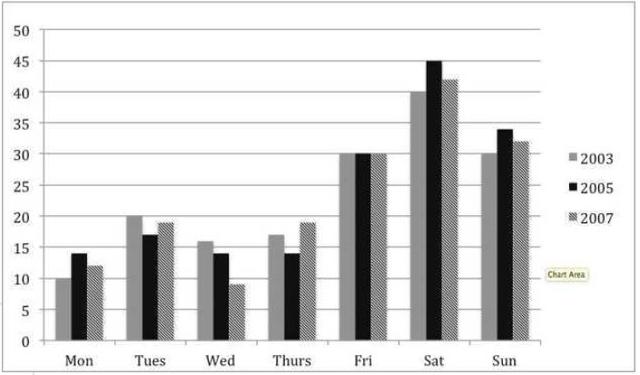
The supplied bar graph illustrates the index of residents visiting the cinema on various days in three years ( 2003, 2005 and 2007) in European countries. Units are measured in percentage.
Overall
, it is obvious that going to films shows higher percentages on Fridays and weekdays. It is noteworthy, that the cinema visitors remained absolutely the same for 3 various years on Fridays.
it is conspicuous that, going to films
culminated at approximately 45% on Saturdays, the highest of any day in three years whilst there was a plateau almost identical by under 15% between Mondays and Thursdays, except for Tuesdays in 2015.
It is interesting to note, that cinema visitors on Wednesdays presented an all-time low index at just above 7,5% throughout the week, in 2007. Linking Words
In contrast
, the percentage of going to a movie theatre in 2003 is been unsurpassed on Tuesdays, Wednesdays and Thursdays over the period commencing from 2003 to 2007.Linking Words