
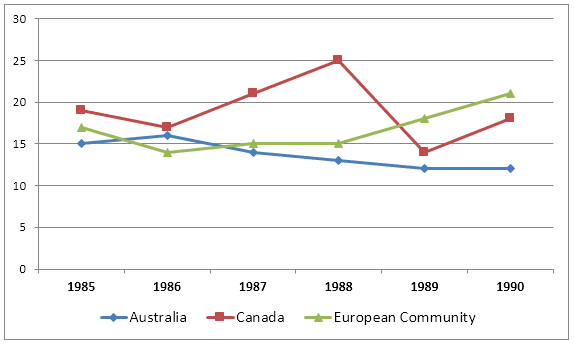
The above graph displays the difference in wheat exports over three different areas. The information is on Australia, Canada and the European community.
Firstly
, in Australia, in 1985, it was 15 Linking Words
then
in 1986 it grew by 16, in 1987 it was around 14, by 1988 it reduces by 12, in 1989 Linking Words
then
it was nearly 11 and in 1990 it was only 12. Linking Words
Secondly
, in Canada it was less than 20 in the year 1985, Linking Words
then
Linking Words
by
1986 it was 14, in 1987 and in 1988 it was 15, Change preposition
in
then
in 1989 it increased by 18 and in 1990 it was highest at 21. In European, the highest was in 1988 with 25 and lowest with 14 in 1989, in 1985 it was 19 Linking Words
then
Linking Words
by
1986 it was 16, in 1987 it was 21 and in 1990 it was 18.
In conclusion, the data is given from 1985 to 1990. The information is about three countries.Change preposition
in