
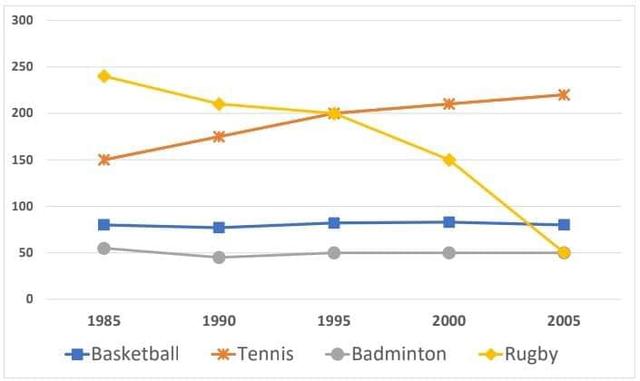
The line graph illustrates the
number
of Use synonyms
people
who join in 4 different kinds of Use synonyms
sports
in a specific region from 1985 to 2005.
From an observational perspective, it can be seen that Tennis had the highest Use synonyms
number
of Use synonyms
people
who participate in Use synonyms
sports
Use synonyms
whereas
Rugby had the lowest Linking Words
number
of Use synonyms
people
in a specific area. (There was a similar downward trend in both Basketball and Badminton in the Use synonyms
number
of participants in 4 different kinds of Use synonyms
sports
between 1985 to 2005).
From the information shown on the line graph, it can be seen that Rugby had the lowest Use synonyms
number
of players. Use synonyms
However
, Rugby increased significantly to about 250 players in 1985 but it dramatically declined about from 250 to 50 players between 1985 to 2005.
Compared to the first half of the period, in the rest of the time shown the chart, it can Linking Words
also
be observed that Tennis had the biggest Linking Words
number
of participants. Between 1985 and 2005, there was a substantial increase of 75 participants in the Use synonyms
number
of Use synonyms
people
joining Use synonyms
sports
.Use synonyms