
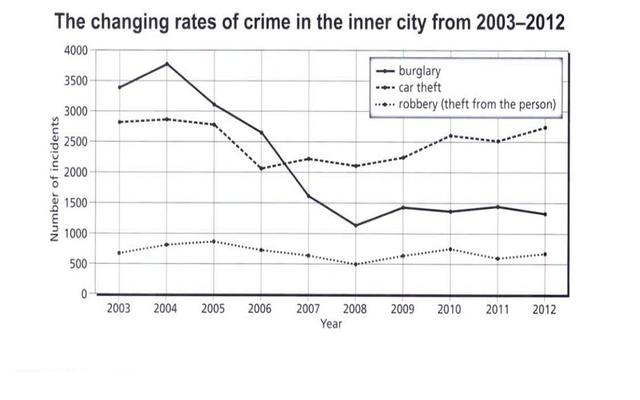
The chart shows the
number
of crimes each year, for three different areas of crimes from 2003 to 2012 in Newport City.
The shared information showed how Burglary recorded the highest Use synonyms
number
, Use synonyms
then
dipped through the years. Linking Words
On the other hand
, car theft witnessed some decrease Linking Words
then
again recorded the same Linking Words
number
of Use synonyms
cases
, and robbery was slightly fluctuating.
By 2003 Burglary recorded almost 3400 Use synonyms
cases
, Use synonyms
then
by 2004 had peaked at the highest Linking Words
number
of almost 3750 Use synonyms
cases
, Use synonyms
then
dipped down quickly to record the lowest Linking Words
number
in 2008 which was approximately 1200 Use synonyms
cases
with little fluctuations but kept within Use synonyms
this
limit until 2012.
Linking Words
However
, car theft recorded the highest Linking Words
number
of about 2750 by 2003 Use synonyms
then
testified a slight decrease to record the lowest Linking Words
number
of almost 2000 Use synonyms
cases
in 2006, Use synonyms
then
again gradually increased to achieve the same Linking Words
number
of Use synonyms
cases
in 2012. Use synonyms
Finally
, by the year ,2003 the robbery had recorded approximately 700 Linking Words
cases
, Use synonyms
then
through the years had kept fluctuating with almost a similar Linking Words
number
of Use synonyms
cases
every year until 2012.Use synonyms