
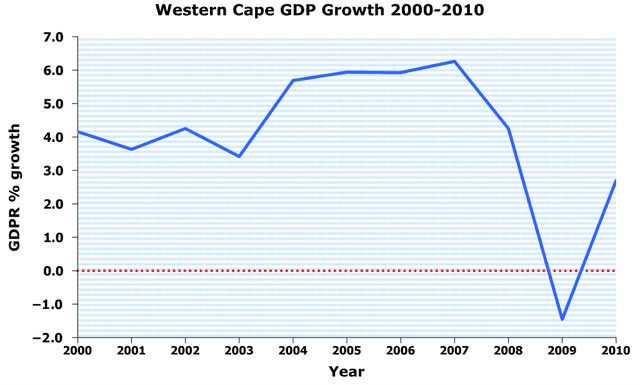
The chart illustrates the percentage variation from 2000 up to 2010 in gross domestic product (
GDP
) in the Western Cape.
Generally, Use synonyms
it is clear that
the rate of growth in Linking Words
GDP
has declined over the 10-year period from 4 per Use synonyms
cent
in 2000 to just over 2 per Use synonyms
cent
in 2010.
Looking at the details, it is evident that from 2000 to 2003, there was a short-term fluctuation in the Use synonyms
GDP
growth rate, which was followed by a sudden increase Use synonyms
at the end
of Linking Words
this
period, with the rate reaching about 5.5 per Linking Words
cent
in 2004. After that, it plateaued for the next three years and peaked at over 6 per Use synonyms
cent
in 2007.
Over the next two years, the percentage of increment in Use synonyms
GDP
plunged to a low of nearly -2 per Use synonyms
cent
in 2009. Use synonyms
However
, after hitting the lowest value, the Linking Words
GDP
increment percentages increased dramatically to over 2 per Use synonyms
cent
in the following year.Use synonyms