
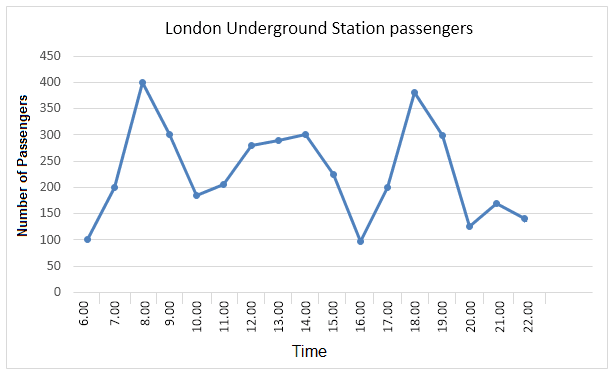
The line graph below illustrates the number of
passengers
in London using the underground station.
Use synonyms
Overall
, The number of transit that used the underground station fluctuated continuously from 6:00 to 22:00.
From 6:00 to 8:00, the travel was increased dramatically, from Linking Words
one
hundred to four Use synonyms
hundreds
people, reached a peak of the chart. After that, It dropped sharply to below two Use synonyms
hundreds
Use synonyms
passengers
from 8:00 to 10:00. That was a same happened with from 16:00 to 20:00, which below Use synonyms
one
hundred Use synonyms
passengers
at 16:00, Use synonyms
then
rose rapidly to slightly four Linking Words
hundreds
Use synonyms
passengers
at 18:00. But It showed a downward trend at 20:00, nearly Use synonyms
one
hundred people.
About the time from 10:00 to 14:00, It was an upward trend steadily, from below two Use synonyms
hundreds
to up to three Use synonyms
hundreds
. Use synonyms
However
, It was the lowest number in the chart, which is below Linking Words
one
hundred. Use synonyms
On the other hand
, from 20:00 to 22:00, It was slightly upward trend at 21:00, from slightly Linking Words
one
hundred to over Use synonyms
one
hundred and fifty. After that, It went down around Use synonyms
one
hundred and thirty Use synonyms
passengers
Use synonyms
at the end
of the day.Linking Words