
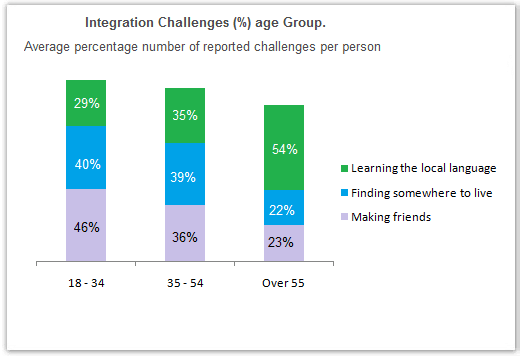
The given chart illustrates the average percentage of 3 various
challenges
that people encounter when they immigrate in 3 different groups of ages. The initial impression is that Use synonyms
while
people who are between 18 and 34 Linking Words
years
old have the biggest proportion of finding accommodations and making friends Use synonyms
challenges
, Use synonyms
immigrants
who are more than 55 Use synonyms
years
old have the biggest contribution to learning the local language challenge
As can be seen,Use synonyms
although
adults between 18 to 34 Linking Words
years
old contribute to the lowest percentage of learning the native tongue of immigrated country, which is 29%, they have the highest ratio of other issues among all age groups. Use synonyms
In contrast
, the over 55 Linking Words
years
old group consists of 54% of people who face learning the local language problem and there are almost the same contribution of finding accommodations and striking up friendships issues in Use synonyms
this
group.
Turning next to Linking Words
immigrants
who are aged from 35 to 54 Use synonyms
years
old , the table clearly shows that the proportion of Use synonyms
immigrants
who encounter learning the tongue of the new country and making friendships Use synonyms
challenges
is approximately 35% and finding somewhere to live problem is responsible for 39% of Use synonyms
challenges
among Use synonyms
this
group of Linking Words
immigrants
.Use synonyms