
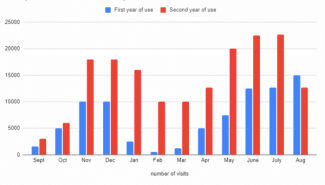
The bar chart illustrates the
quantity
of Change the quantifier
number
visits
by the thousands paid to a community website within the Use synonyms
first
two years of Use synonyms
use
.
Use synonyms
Overall
, there is a greater upward trend from the second Linking Words
year
of Use synonyms
use
compared to the Use synonyms
first
Use synonyms
year
of Use synonyms
use
. Use synonyms
In addition
to that, in both years the website undergoes a drastic fluctuation in Linking Words
numbers
. It can be observed that Use synonyms
initially
in the month of September, Linking Words
number
of Correct article usage
the number
visits
in the Use synonyms
first
Use synonyms
year
of Use synonyms
use
Use synonyms
are
lower than Correct subject-verb agreement
is
second
Change the article
the second
year
of Use synonyms
use
, but Use synonyms
Use synonyms
Correct article usage
the numbers
numbers
of the former Fix the agreement mistake
number
subsequently
surpasses the latter in the final month of August.
In regards to the Linking Words
first
Use synonyms
year
of Use synonyms
use
, Use synonyms
quantity
of Add an article
the quantity
a quantity
visits
increases from about 2000 Use synonyms
visits
in September to 10000 Use synonyms
visits
within 2 months and remains constant for another month. Following that, Use synonyms
numbers
plummet from December to February, reaching a Use synonyms
low-point
of less than approximately 500 Correct your spelling
low point
visits
. The Use synonyms
numbers
rise gradually from February onwards until it reaches Use synonyms
it's
highest at 15000 by August.
Correct your spelling
their
On the other hand
, during the second Linking Words
year
of Use synonyms
use
, the number of Use synonyms
visits
rises sharply from about 2500 Use synonyms
visits
to around 17500 Use synonyms
visits
. Soon, the Use synonyms
visits
dip to 10000 only by February, persisting to March. The trend Use synonyms
then
increases steadily until it touches roughly 22500 Linking Words
visits
in July, but drops once again to less than 13000.Use synonyms