
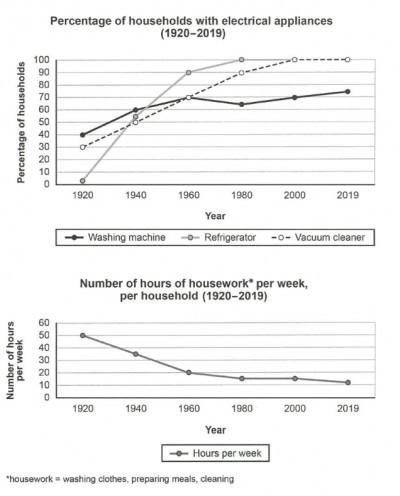
The provided line charts illustrate the percentage of
households
using three distinct electrical appliances and the number of weekly Use synonyms
hours
spent doing Use synonyms
housework
, including washing clothes, preparing meals and cleaning, of each household in a country over the course of 99 years starting from 1920.
Use synonyms
Overall
, it is discernible from the charts that there was a general upward trend in the percentages of these electrical appliances' users and the amount of time spent handling Linking Words
housework
by Use synonyms
households
dropped significantly in the whole period shown.
In 1920, Use synonyms
while
there were 30% and 40% of Linking Words
households
owning refrigerators and washing machines, there was no one using vacuum cleaners and every household spent around 50 Use synonyms
hours
weekly on average doing Use synonyms
housework
. In the following 40 years, the proportions of Use synonyms
households
owning each of these tools increased drastically and they only had to spend just about 20 Use synonyms
hours
a week for their Use synonyms
housework
in 1960. During Use synonyms
this
period, vacuum cleaners became the most popular appliance among the three studied ones with 90% of Linking Words
households
using them Use synonyms
whereas
the figures for refrigerators and washing machines both stood at 70%.
From 1960 onwards, Linking Words
while
the percentages of Linking Words
households
using washing machines and vacuum cleaners continued to rise and finished at 100% in the final year, the figure for refrigerators fluctuated before finishing at approximately 74% in 2019. Meanwhile, Use synonyms
households
spent a lesser amount of time every week handling their Use synonyms
housework
over the years. In 2019, each household only spent just around 11 Use synonyms
hours
per week on these tasks.Use synonyms