
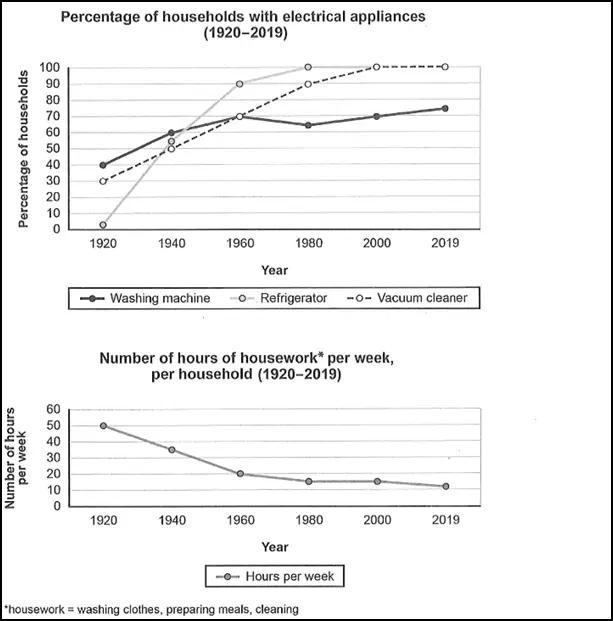
The first line graph illustrates the proportion of families having electrical appliances, and the second one presents information on the time spent on housework per week per household in one particular nation over a period of 99 years (1920-2019).
Overall
, the percentage of families with washing machines, refrigerators and vacuum cleaners all rose between 1920 and 2019, Linking Words
while
the time taken to do housework showed an opposite trend.
In 1920, the figure for households that had refrigerators stood at just over zero, but it saw a dramatic rise over the following 60 years, from about 2% in 1920 to 100% in 1980 and Linking Words
then
remained stable between 1980 and 2000. Linking Words
Similarly
, families who had vacuum cleaners Linking Words
also
witnessed a sharp increase over the same period, from 30% in 1920 to approximately 90% in 2000, and Linking Words
then
gradually grew to 100% in 2000. Households with washing machines witnessed a rapid rise, from 40% in 1920 to 65% in 1960 when vacuum cleaners exhibited the same proportion, and Linking Words
then
nearly steady until 2019.
The time consumed on housework fell significantly between 1920 (roughly 50 hours) and 1960 (around 20 hours), and Linking Words
then
gradually went down to 10% in 2019.Linking Words