
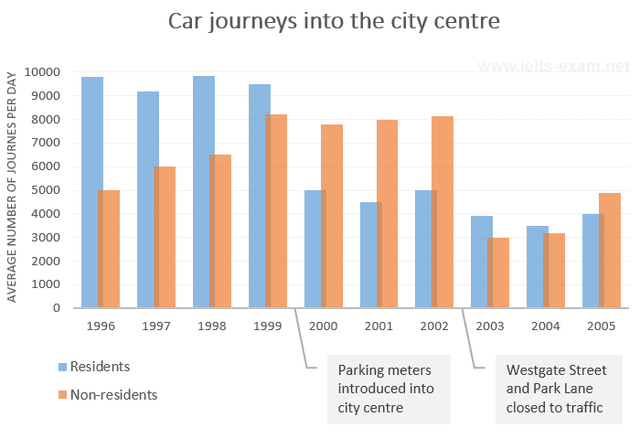
The bar chart illustrates the details about the amount vehicle trips into the town made by citizens and non-citizens. The unit of measurement is the amount of Journey per day.
Overall
, it can be seen that the movement of inhabitants was high in the first few years.
Linking Words
To begin
, the value gotten from locals trip was almost 10000, which did not get below 9000 from 1996 to 1999 . Linking Words
While
non-locals recorded from around 5000 to an increase of about 8000 within the same year. An improvement in the parking meters leads non-residence to make journeys of approximately 8000 per day between 2000 to 2002. But Linking Words
then
the value of residents dropped dramatically to 5000 and below.
Linking Words
Furthermore
, Linking Words
westgate
street and park lane were shut to traffic.Change the capitalization
Westgate
this
brought a significant decrease with both individual types of movement, from 2002 to 2005 locals could not exceed more than 5000. Linking Words
While
non-citizens where were below 4000 , in 3005 they gradually rose to about 5000 journeys.Linking Words