
The given
table
depicts that the figure of Use synonyms
visitors
to Ashdown Museum surged after the renovation. The presented Use synonyms
table
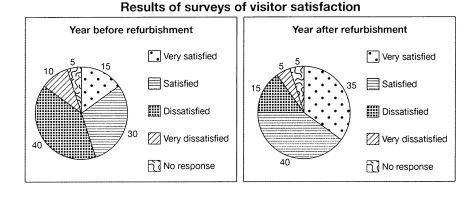
shows the numerical values before and after the refurbishment. The pie chart reveals whether the renovation project was successful or not.
Use synonyms
Overall
, the flow of Linking Words
visitors
to the museum gradually increased and the data from the Use synonyms
table
and pie chart explores the review is better from the side of Use synonyms
visitors
’ side after recreation works.
As is presented in the Use synonyms
table
, the total number of Use synonyms
visitors
before refurbishment was 74,000. Use synonyms
Also
, from the surveys it is obvious that the dissatisfied opinions are nearly 40 per cent, Linking Words
following
very dissatisfied at 10 per cent.
Wrong verb form
followed by
According to
the year after refurbishment details, the number of Linking Words
visitors
Use synonyms
as well as
the review of satisfied comments from Linking Words
guest
, ultimately at the peak in the history of Ashdown Museum. Fix the agreement mistake
guests
Furthermore
, all the percentages related to dissatisfaction are reduced after the renovation works.Linking Words