
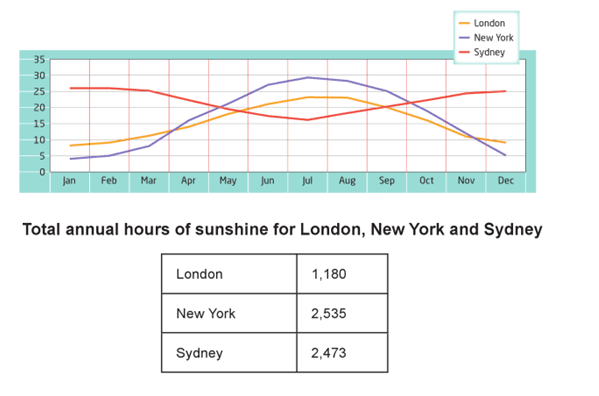
The line graph demonstrates the mean
temperature
during the month and the table represents the mean number of sunny Use synonyms
hours
in three different cities Use synonyms
such
as Linking Words
London
, New Use synonyms
York
and Sydney.
It is interesting to notice that the Use synonyms
temperature
trend in Use synonyms
London
almost repeats the one in New Use synonyms
York
. At the same ,time Sydney’s line graph shows a completely opposite trend with the lowest Use synonyms
temperature
in July, Use synonyms
whereas
it’s the hottest month in the two other cities.
Regarding the average climate in New Linking Words
York
, January is the coldest month of the year with approximately 4 Use synonyms
degrees
. Use synonyms
Then
the Linking Words
temperature
continued rising steadily until it reached its peak in July at almost 30 Use synonyms
degrees
. Use synonyms
Following
Linking Words
this
, we can observe that the heat started to decline constantly from July until December for both cities, Linking Words
London
and New Use synonyms
York
, ending at 10 Use synonyms
degrees
and 5 Use synonyms
degrees
respectively. Use synonyms
In contrast
to New Linking Words
York
’s Use synonyms
temperature
, January and December are the hottest ones, over a given time period, almost reaching 25 Use synonyms
degrees
. Turning to details, the Use synonyms
temperature
started to decrease from January to July, ending with about 15 Use synonyms
degrees
. As we can observe from the table, New Use synonyms
York
ended up with the highest score for sunshine Use synonyms
hours
, Use synonyms
while
Linking Words
London
got the lowest score with only 1180 annual Use synonyms
hours
.
Use synonyms
Overall
, we can see that despite the fact that the Linking Words
temperature
trends of New Use synonyms
York
and Use synonyms
London
look familiar, Use synonyms
London
resulted in the least number of sunshine Use synonyms
hours
throughout the year.Use synonyms