
The aforementioned graphs indicate the outcome of a survey among the
adults
to continuing their education. The first one shows the matters that people want to Use synonyms
study
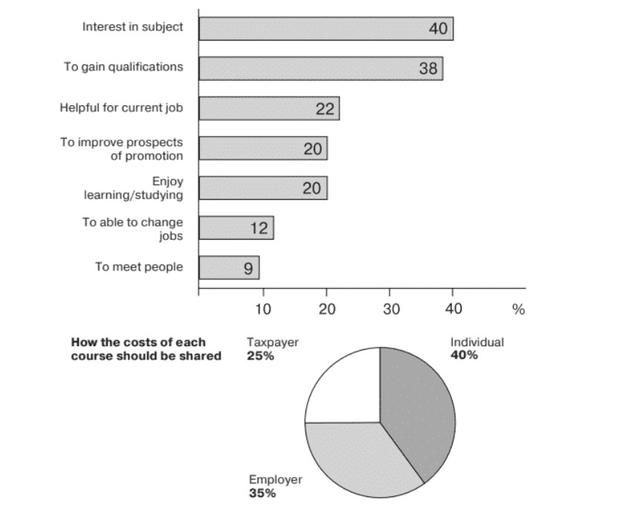
. The second chart demonstrates society's thoughts about the cost of each course and how should be split.
The bar chart illustrates that 40 per Use synonyms
cent
of Use synonyms
adults
want to Use synonyms
study
because they are interested in a subject. The second top per Use synonyms
cent
value is that they want to gain a qualification. 22 per Use synonyms
cent
of Use synonyms
adults
stated that studying in higher courses will help their current job. The improved prospect of promotion and enjoying from the Use synonyms
study
both have a 20 per Use synonyms
cent
rate. About 12 per Use synonyms
cent
aim to change their job Use synonyms
due to
Linking Words
study
. The Use synonyms
last
group, about 9 per Linking Words
cent
, just need to meet new people.
The pie graph related to society's belief in the cost of courses. The majority of people think that individuals should pay for themself, Use synonyms
this
statistic is about 40 per Linking Words
cent
. Use synonyms
However
, about 35 per Linking Words
cent
say that employers should pay the cost of Use synonyms
study
. Use synonyms
Finally
, the Linking Words
last
group believe that payment is the duty of taxpayers.
The result of the survey showed the reason for the Linking Words
study
among Use synonyms
adults
and their beliefs about who should pay the fee. It is interesting that most of them want to Use synonyms
study
because it is their desire. Ultimately, they think the payment is on their own.Use synonyms