
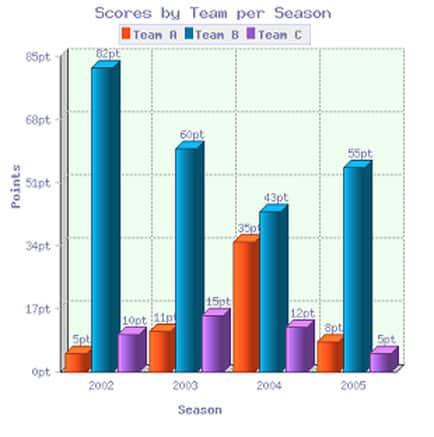
The presented diagram provides a comprehensive comparison of the total
scores
collected by 3 teams in four distinct seasons.
Use synonyms
Overall
, Linking Words
Team
Use synonyms
B
had the highest Use synonyms
scores
among the other 2 teams over four given seasons. Use synonyms
On the contrary
, the total Linking Words
scores
of Use synonyms
Team
A and Use synonyms
Team
C remained below Use synonyms
Team
Use synonyms
B
.
Upon Use synonyms
further
examination, in 2002, Linking Words
Team
Use synonyms
B
collected the highest results around 82 Use synonyms
points
compared to other periods. During 2003 and 2004, the record of Use synonyms
team
Use synonyms
B
gradually decreased to 63 Use synonyms
points
and 43 Use synonyms
points
respectively. Use synonyms
Otherwise
, in 2005, there was a bounce back where Linking Words
Team
Use synonyms
B
Use synonyms
scores
obtained a significant increase which accounted for 55 Use synonyms
points
.
Turning to the other remaining data, it is evident that 3 out of 4 seasons (2002, 2003, and 2005) depicted Use synonyms
team
A as the lowest Use synonyms
scores
gained which accounted for under 11 Use synonyms
points
. Use synonyms
In addition
, there was a huge gap of around 79 Linking Words
points
between Use synonyms
Team
A and Use synonyms
Team
Use synonyms
B
in 2002. Use synonyms
However
, Linking Words
Team
A with 35 Use synonyms
points
successfully dethroned Use synonyms
Use synonyms
team
C with 12 Capitalize word
Team
points
as the second-highest Use synonyms
records
collected in one season.Fix the agreement mistake
record