
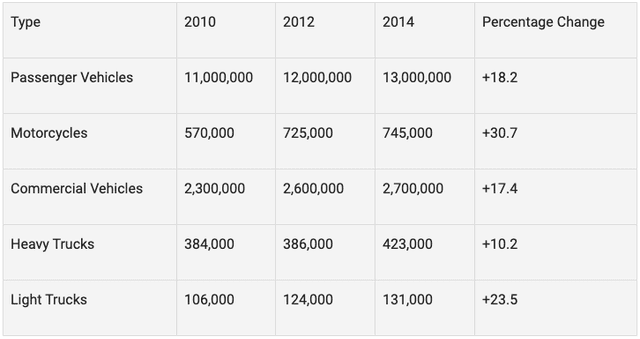
The table compares the number of
vehicles
registered in one country namely Australia in 2010, 2012 and 2014.
Use synonyms
According to
the Linking Words
second,
third and fourth columns of the chart, the numbers of passenger Linking Words
vehicles
in 2010, 2012 and 2014 were 11000000, 12000000 and 13000000 respectively, which were the largest ones. Use synonyms
However
, light trucks in the same period took up the smallest number, which was 106000, 124000 and 131000 respectively.
Regarding the fifth column of the chart, Australia witnessed a dramatic rise in the proportion of motorcycles from 2010 to 2014, being 30.7. The percentages of light truckers, passenger Linking Words
vehicles
and commercial Use synonyms
vehicles
went up moderately from 2010 to 2014, being 23.5, 18.2 and 17.4 respectively. Use synonyms
Conversely
, the trend showed a slight rise in the proportion of heavy truckers from 2010 to 2014, being 10.2.
By way of conclusion, all types of Linking Words
vehicles
registered increased from 2010 to 2014, especially motorcycles. People nowadays pay much attention to reducing pollution and being environmentalists by using Use synonyms
vehicles
.Use synonyms