
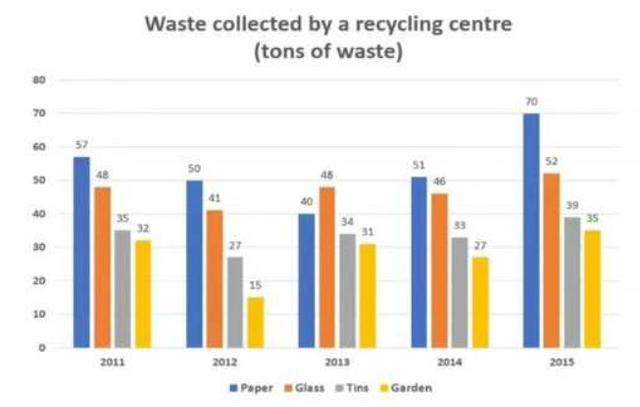
The supplied information depicts the amount of different four types of garbage
Paper
, Glass, Use synonyms
Tins
and Garden which were collected for recycling between 2011 and 2015. Use synonyms
Overall
, Linking Words
it is clear that
all the provided figures ascended and the recycling centre collected a massive amount of Linking Words
paper
compared to other kinds of waste throughout the given timescale.
Moving to the detail, the proportion of Use synonyms
paper
started at 57 Use synonyms
tons
in the initial year but Use synonyms
this
rate decreased dramatically for 2 years. Linking Words
However
, the facility started to collect Linking Words
paper
keenly again and the proportion reached just 70 Use synonyms
tons
in the final year. Use synonyms
On the other hand
, the ratio of collecting grass exceeded Linking Words
Paper
in 2013 and the percentage of Use synonyms
this
garbage was maintained for a given 4 years.
It is worth noting that both Linking Words
Tins
and Garden fluctuated drastically for the supplied timeframe. Use synonyms
Tins
started at approximately 35 Use synonyms
tons
. In 2012, the percentage of the mentioned two categories of litter crept down to 27 and 15 respectively. Use synonyms
However
, the rate of Linking Words
Tins
increased gradually by 12 Use synonyms
tons
and that of Garden Use synonyms
also
ascended to 35 for 3 years.Linking Words