
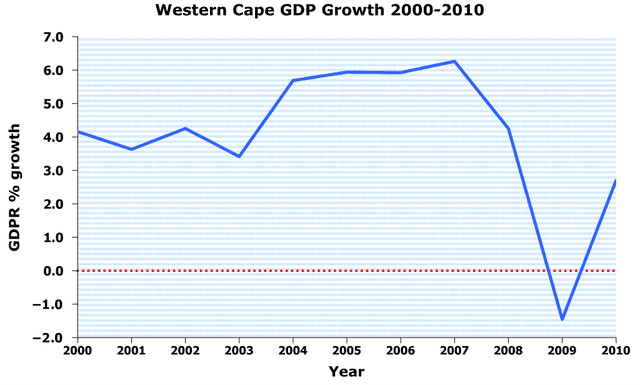
The display chart shows the changes in gross domestic product (GDP) in the western Cape between 2000 and 2010. The below information describes GDPR growth in %.
In the
year
2000, it was near 4, Use synonyms
then
in the Linking Words
year
2001 it was near 4, Use synonyms
then
it grew by 4 in the Linking Words
year
2002, in the Use synonyms
year
2003 it was around 4, in the Use synonyms
year
2004 it was 6, in the Use synonyms
year
2005 Use synonyms
as well as
it was more than 6, but in the Linking Words
year
2007 it was the highest with 6.5, in the Use synonyms
year
2008 it was nearby 4, in 2009 it was -1 and in the Use synonyms
year
2010 it was 2. But Use synonyms
However
, The highest was in the Linking Words
year
2007. From 2003 to 2008 it kept on increasing. The data is in %.
Use synonyms
To conclude
, the above information describes the GDPR growth in %. The information is from the years 2000 to 2010.Linking Words