
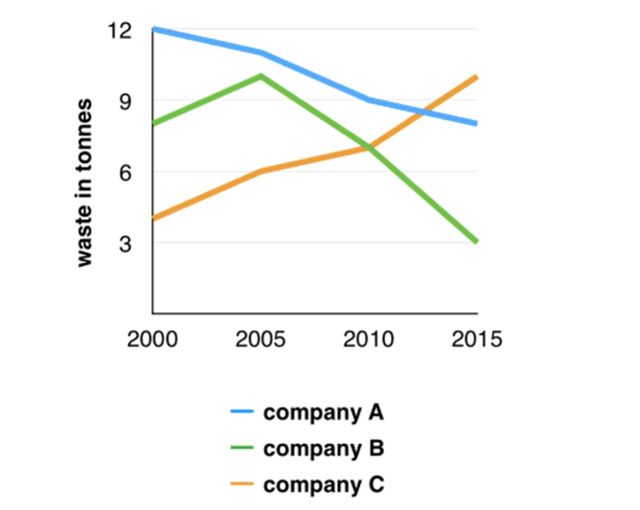
The graph below illustrates the value of trash made by three companies from 2000 to 2015.
Overall
, it's easy to see that companies a and b decreased the amount of garbage they had produced. Linking Words
In
Linking Words
contrast
Add a comma
,contrast
waste
amount of Use synonyms
company
c has been growing all over the years.
In the year 2000 Use synonyms
company
A was producing about 12 tons of Use synonyms
waste
and all over the given period their numbers gradually declined to about 8 tons in 2015. For the first five years Use synonyms
company
B grew its volume of Use synonyms
waste
, but Use synonyms
then
the level of Linking Words
waste
significantly dropped more than 3 times from over 9 Use synonyms
tonnes
per year in 2005 to 3 Use synonyms
tonnes
in 2015.
Use synonyms
Company
C started with little more than 3 Use synonyms
tonnes
in 2000Use synonyms
,
and showed an upward trend through the years. In 2015 their amount of garbage was over 9 Remove the comma
apply
tonnes
and exceeded Use synonyms
a
Correct article usage
the
waste
volume of two other companies.Use synonyms