The table and charts below give information on the police budget for 2017 and 2018 in one area of retain the table shows where the money came from and the chart show how it was distributed summarize the information by selecting and reporting the main features and make comparisons very relevant

The table and charts below give information on the police budget for 2017 and 2018 in one area of retain the table shows where the money came from and the chart show how it was distributed summarize the information by selecting and reporting the main features and make comparisons very relevant
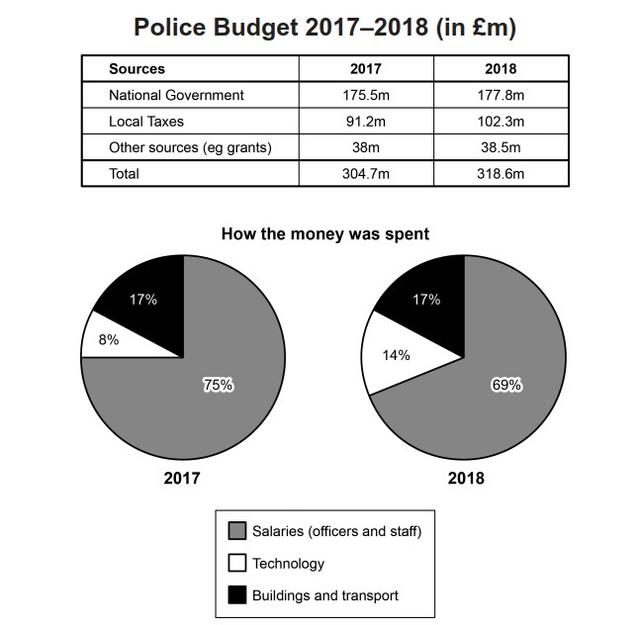
The given table and pie charts provide information regarding the amount of
money
allocated to police in an area located in Britain, the table illustrates the origin of
money
and the pie charts show how it was distributed in different sections. It is noticeable to see that the majority of funds came from the national government and it was mostly spent on officers and staff salaries.
According to
the table, in 2017, the national government devoted 175.5
million
to the Britain police,
whereas
in 2018, the amount of
money
that came from the national government increased to 177.8
million
.
Additionally
, the budget allocated by local taxes
also
rose from 91.2
million
in 2017 to 102.3
million
in 2018.
Finally
, there was a significant increase in the total number of police budget from 2017 to 2018, reaching 318.6
million
. Pie charts illustrate that the majority of
this
fund was allocated to paying the officers and staff in both 2017 and 2018. Interestingly,
while
the amount of total budget levelled up in 2018 compared to 2017, only 69% of it was spent on salaries, which is less than
this
figure in 2017.
Moreover
, in 2017, only 8% of
this
total fund was allocated to the technology part,
however
,
this
number grew in 2018 to 14%.
Also
, the
money
spent on buildings and transport remained the same in both years.
Submitted by reza.ehz68 on

Unauthorized use and/or duplication of this material without express and written permission from this site’s author and/or owner is strictly prohibited. Excerpts and links may be used, provided that full and clear credit is given to Writing9 with appropriate and specific direction to the original content.

Linking words: Don't use the same linking words: "also".
Basic structure: Change the second paragraph.
Vocabulary: Replace the words money, million with synonyms.
Vocabulary: Rephrase the word "give" in your introduction.
Vocabulary: Rephrase the word "information" in your introduction.
Vocabulary: The word "charts" was used 3 times.
Vocabulary: The word "table" was used 3 times.
Vocabulary: The word "illustrates" was used 2 times.
Vocabulary: The word "amount" was used 3 times.
Vocabulary: The word "increased" was used 2 times.
Vocabulary: Use several vocabularies to present the data in the second paragraph.
Topic Vocabulary:
  • fiscal
  • allocation
  • revenue
  • government grants
  • taxpayer contributions
  • expenditure
  • financial year
  • budgetary changes
  • capital investment
  • operational costs
  • shift in priorities
  • percentile changes
  • incremental increase/decrease
  • funded
  • allocated
  • resources
  • budgeting decisions
What to do next:
Look at other essays: