
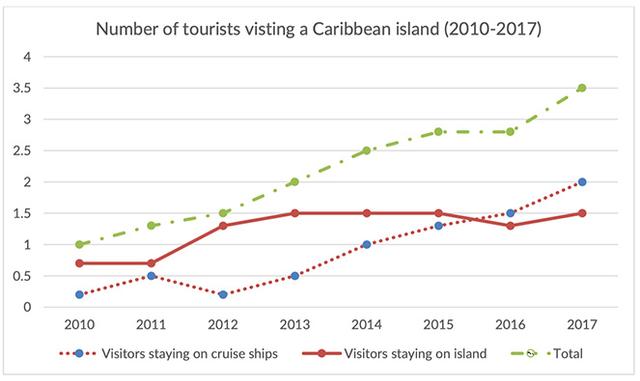
The graph presents information relating to the statistics of guests visiting a particular Caribbean island between 2010 and 2017 . The unit is measured in
million
Use synonyms
Overall
, it is readily clear that the total number of visitors rose throughout the given course, hitting 3.5 Linking Words
million
.
Regarding the sum of strangers who were spending time on the island, at the beginning of the time, they were around 0.75 Use synonyms
million
, Use synonyms
then
stayed constant for 1 year before growing to roughly 1.25 Linking Words
million
in 2012. The figure which went up to 1.5 Use synonyms
million
in 2013 ,continued unchanged till 2015. Before turning back to the same number in 2017 as in 2015 , the total of travellers dropped to about 1.25 Use synonyms
million
in 2016 .
Use synonyms
Lastly
,turning to those who reside on cruise ships, the statistic of people regularly went on to increase ,starting with approximately 0.25 Linking Words
million
over the period of time,except in 2012 when the drop was experienced . The proportion reached 2 Use synonyms
million
Use synonyms
at the end
of the periodLinking Words