
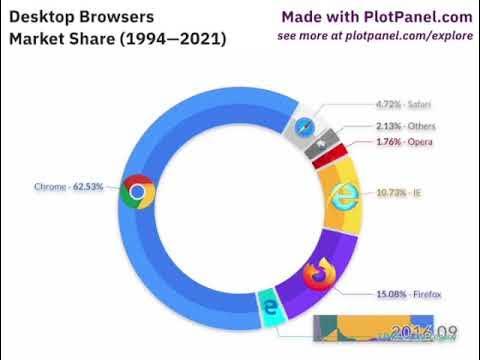
The pie charts display the usage share of desktop
browsers
, over a two-year period between 2019 and 2021.
Use synonyms
Overall
, what stands out from the graph is that Chrome made the highest contribution to the production in desktop Linking Words
browsers
in both years, Use synonyms
whereas
other Linking Words
browsers
made up the smallest part of the chart in 2021, but Edge and Firefox climbed to minimal levels.
Looking at the details, in 2019, chrome had nearly half of the Use synonyms
overall
share and Linking Words
this
decreased to 2 % and accounted for 67% in 2021. The next similar biggest Linking Words
browsers
were Safari and Firefox with almost a tenth in 2019 and Firefox declined to 8 %, Use synonyms
however
, Safari grew to exactly one in ten in 2021
Edge was the largest loser with a tiny fraction, but it surged and amounted to 9% in 2021. Other was the second biggest browser with an insignificant minority proportion, Linking Words
nevertheless
, it dropped to 6 % in 2021.Linking Words