
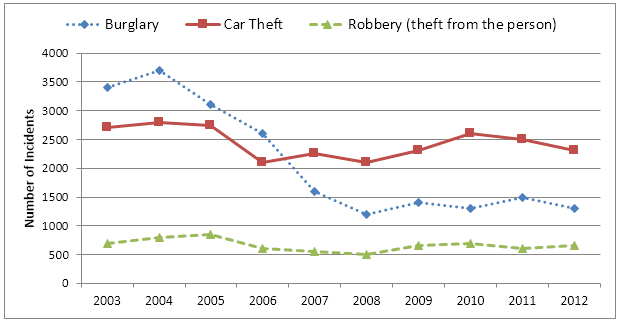
The data given indicates the rate of illegal activities in three crime fields in Newport during nine years.
It is apparent that the burglary rate has dropped significantly in recent years,
while
numbers of crimes Linking Words
as
car theft and robbery have changed slightly and maintained at the same level.
In 2003, burglary was the highest committed crime with approximately 3400 incidents and the following year it reached its peak of around 3600. Correct quantifier usage
such as
Further
, it continued to have a downward trend by reaching its minimum of about 1300 cases and was overtaken by car theft Linking Words
at the end
of the period. Linking Words
While
, in the beginning of the period given, despite of the car theft rate was considerably less than burglary with around 2600 incidents, in the end, it has become the most committed crime type with 2400 cases. Linking Words
Whereas
, robbery remained a less committed illegal activity and levelled off between 500-1000 incidents throughout all years.Linking Words