
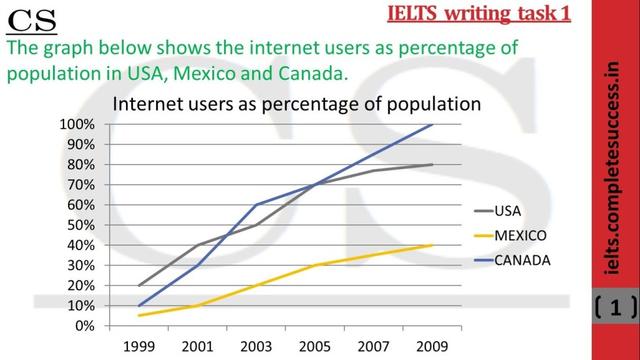
The diagram below illustrates the proportion of
internet
surfers over ten-year periods in three different nations USA, Mexico and Canada.
From an Use synonyms
overall
perspective, it is noticeable that the majority of populations in 1999 stared at a very low rate of Linking Words
users
Use synonyms
while
in, contrast the Linking Words
users
became abundant throughout the reporting period.
Observing the details, it is remarkable that the USA had the most Use synonyms
internet
Use synonyms
users
in 1999 and rose steadily to 70% in 2005 Use synonyms
then
slowly reached its peak at 80% in 2009. Linking Words
Similarly
, Canada started in 1999 and remained in the middle Linking Words
then
experienced fluctuation of increasing and soared to the top of over 100% in 20's century.
Linking Words
On the contrary
, Mexico began with the lowest rate of Linking Words
internet
surfers in 1999 and slightly climbed up and maintained approximately 30% throughout the reporting time.
Use synonyms
To sum up
, with what has been analysed and compared, it is crucial to highlight that Linking Words
internet
Use synonyms
users
are more present in every country.Use synonyms