
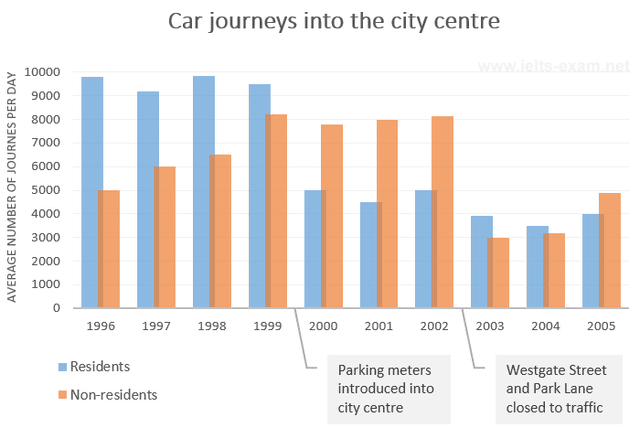
The bar chart depicts data about the amount of vehicles passing the city centre from
residents
and Use synonyms
non-
Use synonyms
residents
between 1996 and 2005.
Use synonyms
Overall
, it is obvious that the car journeys made by Linking Words
residents
were much higher than the Use synonyms
non-
Use synonyms
residents
in the 1990s era and it decreased as it entered the year of 2000s because of the introduction of parking meters. Use synonyms
On the contrary
, Linking Words
non-
Use synonyms
residents
had a stable increase in years 1990s and a slight fall when entering the year 2000 continued by a dramatic fall in 2003 as Westgate Street and Park Lane closed to traffic.
Use synonyms
Initially
, the Linking Words
residents
used their cars a lot before parking meters were introduced. The number of journeys was approximately reaching 10000 but it fluctuated by halves and barely made changes in the numbers. Use synonyms
Then
, the fall continued by 1000 in 2003 and it didn’t have many changes as the maximum number of Linking Words
residents
using their cars was 4000 people.
Use synonyms
Furthermore
, for Linking Words
non-
Use synonyms
residents
, the amount started at 5000 at the beginning of the report and gradually increased to 8000 cars in 1999. After the parking meters were introduced, the number stayed at the same rate, making it higher than the Use synonyms
residents
’ journeys until 2003. When Westgate Street and Park Lane were closed to traffic, there was a dive in numbers to 4000 and a slight increment in the year 2005.Use synonyms