
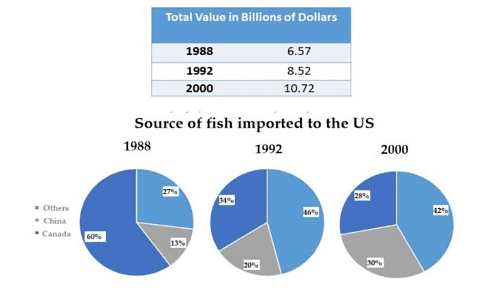
The table and pie charts above illustrate money spent on imported
fish
and the Use synonyms
fish
proportion purchased from China, Canada and other countries, sent to the United States from 1988 to 2000, divided into three parts.
It's clear that the total money spent increases from time to time. Use synonyms
In addition
, the purchasing percentage from each country differs, depending on the year.
The total money allocated for imported Linking Words
fish
is at the highest in 2000 close to $10.72 billion, whilst in 1998 only $6.57 billion was used and in between, $8.52 billion was washed out in 1992. Use synonyms
Overall
, demand for imported Linking Words
fish
is always rising and the trend has never decreased. Over a decade, the product sent from China to the United States has never reached above 30%. In 1998, nearly 13%, slowly climbing up in 1992 by 20% and 30% in 2000. It proves consistency in increasing products imported from China.
Use synonyms
On the contrary
, the government got fewer products from Canada Linking Words
at the end
of 2000. In 1988, almost the majority were bought from Canada 60% in 1988. Linking Words
However
, purchasing was gradually down in 1992 by almost 34% and in 2000 just 28%. Other than that, the government Linking Words
also
bought from other unknown countries. We can say that it's an unstable number because in 1988 it showed 27%, whilst in 1992 and 2000 were all close to 45%.Linking Words