
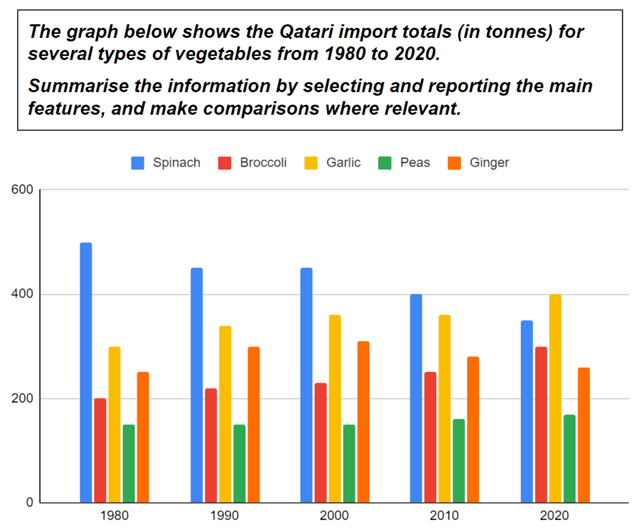
The presented graph depicts data about the total
number
of Use synonyms
imports
(in tons) by Qatari for various types of vegetables from 1920 to 2020.
Use synonyms
Overall
, it is evident that Spinach was the biggest contributor to Linking Words
imports
for 30 years, starting from 1980 to 2010. Only in 2020, the total Use synonyms
number
of Use synonyms
imports
for Spinach was overpassed by Garlic.
Upon taking a closer examination, it was observed that the total Use synonyms
number
of Use synonyms
imports
of Spinach experienced a gradual decrease over the period, starting from about 500 in 1980 to 350 tons in 2020. Use synonyms
In contrast
, it was noticed that the Linking Words
number
of Use synonyms
imports
for both Broccoli and Garlic gradually increased every decade, resulting in them becoming the top three vegetables with the biggest Use synonyms
number
of Use synonyms
imports
in 2020.
Through a closer look, it was shown that Ginger's Use synonyms
number
of Use synonyms
imports
fluctuated, starting with a gradual increase from 1980 to 2000 Use synonyms
then
followed by a steady fall to 2020. Linking Words
Conversely
, a relatively stable pattern was observed for Peas throughout the period.Linking Words