
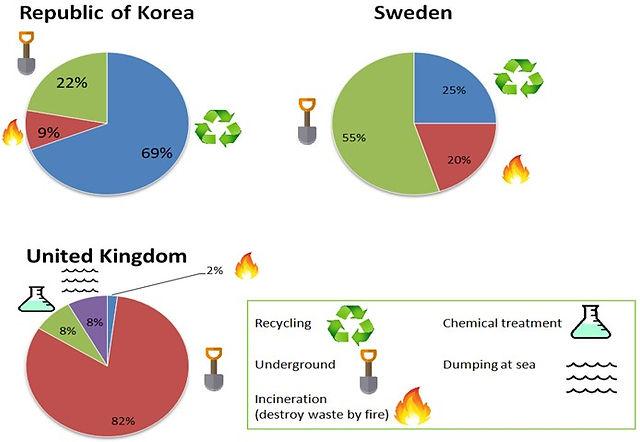
The three pie charts illustrate the ways the United Kingdom, the Republic of Korea and Sweden handle their unwanted rubbish.
Overall
, all countries share the same number of methods in varying degrees; except in the UK, they use four forms as opposed to three Linking Words
such
as dumping it at the sea and chemicals.
Linking Words
Firstly
, recycling is the top method of choice in Korea at 69% and underground follows next at 22%. The least preferred choice is incineration at 9%. Linking Words
Although
the same methods are used in Sweden, the most preferred option at 55% is placing them underground. Linking Words
This
is followed by recycling at 25% and Linking Words
then
coming in Linking Words
last
is burning by fire at 20%.
Linking Words
In contrast
, the UK Linking Words
however
does not recycle at all. Linking Words
Instead
, their largest treatment of waste is using underground at 82%. Linking Words
In other words
, Linking Words
that is
more than four times Sweden's data. They are the only country out of the three to use chemical treatments and the sea; both share an equal value of 8% each. Linking Words
Finally
, their least preferred option for handling rubbish is by fire, at only 2%.Linking Words