
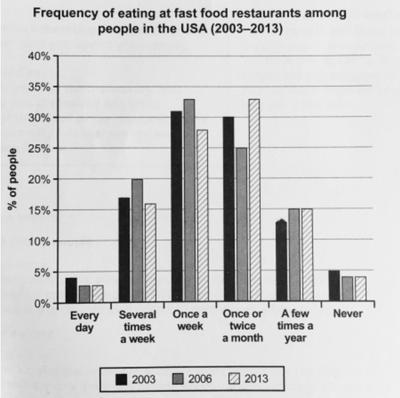
The graph illustrates how many times the
people
of the USA went to fast Use synonyms
food
restaurants between 2003, 2006, and 2013. Use synonyms
Overall
, it can be seen that in the given period, the majority of the US citizens often ate at fast Linking Words
food
restaurants once a week or once or twice a month, Use synonyms
while
they rarely consumed fast Linking Words
food
as their daily habit.
In 2003, the frequency of Use synonyms
people
eating fast Use synonyms
food
in the frequency of once a week stood at around 32%, which had become the most. Use synonyms
Likewise
, the majority of them shared a similar frequency and eating Linking Words
behavior
in 2006, with approximately 33%. Change the spelling
behaviour
On the other hand
, Linking Words
people
in the US spent only once or twice a month in 2013 with the same percentage as in 2006.
Use synonyms
In contrast
, they did not purchase junk Linking Words
food
for their daily consumption. Across the three years, the percentage of Use synonyms
people
in the US who spent their time in fast Use synonyms
food
restaurants was below 5%.Use synonyms