
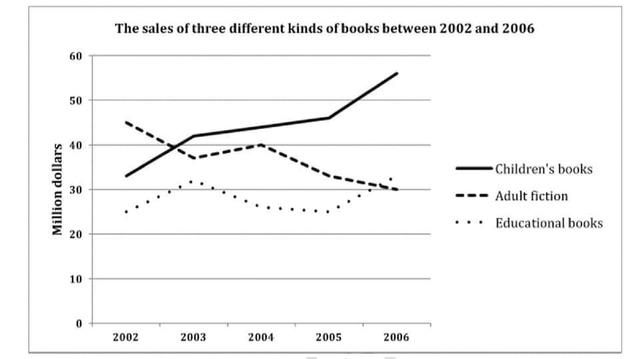
The line graph illustrates the number of
books
sold in three different categories for a period of 4 years starting from 2002.
As can be seen from the graph, the number of Use synonyms
books
sold for children saw a significant rise between 2002 and 2006 Use synonyms
while
the other two categories of adult fiction and educational Linking Words
books
observed their Use synonyms
fluaction
in Correct your spelling
function
sales
numbers.
The Use synonyms
sales
of children's Use synonyms
books
started at nearly 32 Use synonyms
million
Use synonyms
dollars
and grew steadily until Use synonyms
it
reached Correct pronoun usage
they
its
highest peak at more than 55 Correct pronoun usage
their
million
Use synonyms
dollars
by the year Use synonyms
of
2006.
Change preposition
apply
Furthermore
, the Linking Words
sales
of adult fiction fluctuated with a downward trend until it reached the lowest point at 30 Use synonyms
million
Use synonyms
dollars
in 2006. Meanwhile, the number of Use synonyms
books
sold for educational purposes saw the opposite pattern when it varied with an upward trend during the period before it reached the highest point of Use synonyms
sales
at approximately 31 Use synonyms
million
Use synonyms
dollars
in 2006.Use synonyms