
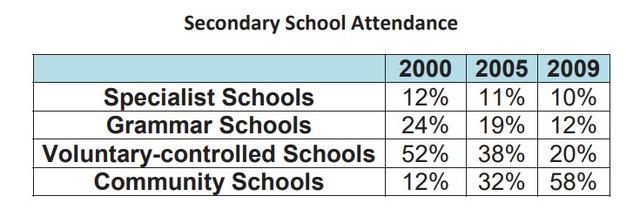
The given table illustrates the data information of four different types of secondary
schools
which Use synonyms
students
attend in the years 2000, 2005 and 2009. Use synonyms
Overall
, Linking Words
it is clear that
the proportions of Linking Words
a
number of Correct article usage
the
students
in 2005 were the lowest among other years. Use synonyms
Additionally
, the number of pupils who attend Linking Words
specialist
Use synonyms
schools
accounted for the lowest percentages.
In 2000, voluntary-controlled Use synonyms
schools
were the most popular among parents to take their children there with almost half of them about 52% followed by Grammar Use synonyms
schools
which were 24% and Use synonyms
Specialist
and community Use synonyms
schools
with the same percentage of 12% of all Use synonyms
students
. Meanwhile, graders in 2009 tended to go to community Use synonyms
schools
more by 58% and at the same time less by 10% for Use synonyms
specialist
Use synonyms
schools
.
Use synonyms
By contrast
, as is shown by the table, 2005 witnessed a lower trend compared to 2009 and 2000. the lowest number of Linking Words
students
were willing to attend Use synonyms
specialist
Use synonyms
schools
Use synonyms
as well as
2000 and 2009 with a proportion of 11% Linking Words
while
, voluntary-controlled and community Linking Words
schools
were the most popular ones with 38% and 32%, respectively.Use synonyms