
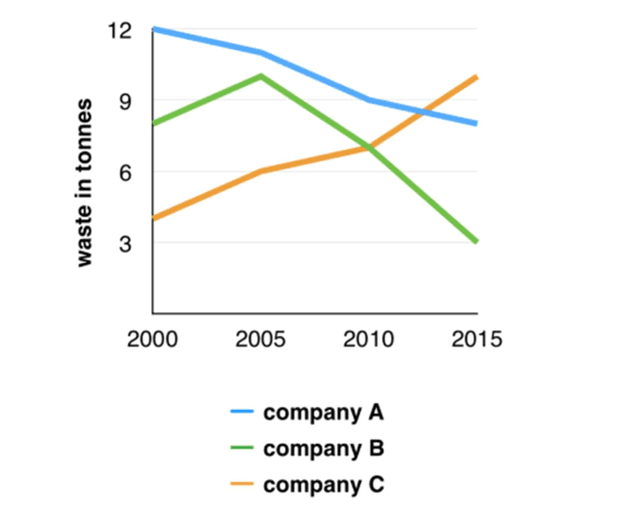
The line graph depicts the dash of
waste
manufactured by 3 companies from 2000 to 2015.
Use synonyms
Overall
, it is noticeable that Linking Words
company
A was the most popular fabric before 2012 when Use synonyms
company
C replaced it and obtained the highest amount of Use synonyms
waste
, Use synonyms
whereas
Linking Words
company
B lowest. Use synonyms
Furthermore
, Linking Words
Use synonyms
company
A and B showed downward trends, Fix the agreement mistake
companies
while
Linking Words
company
C upward trends.
Use synonyms
To begin
with Linking Words
Use synonyms
company
A, it was Capitalize word
Company
on
Change preposition
at
peak
which accounted for 12 in 2000 . Add an article
the peak
a peak
Therefore
, it decreased gradually to 8 in the final years. In terms of Linking Words
company
Use synonyms
B
it increased to approximately 10 in 2005 before falling Add a comma
B,
up
to 3 in the next 10 years and was the Change preposition
apply
company
which had the smallest amount of Use synonyms
waste
throughout the period.
With regards to Use synonyms
company
C, it accounted for under 3 which rose marginally to 6 in 2005. Ultimately, it increased progressively to 11 roughly in the final years and was the fabric which obtained the biggest amount of Use synonyms
waste
over the period in question.Use synonyms