
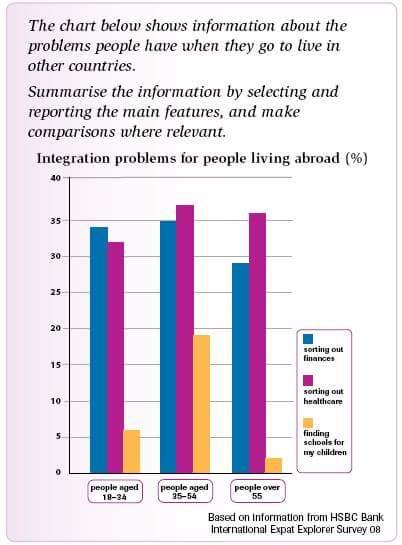
The given bar chart illustrates the data which reveals the percentage of difficulties for three different age groups in three categories which people face when they go to live abroad.
Overall
, Linking Words
it is clear that
adults over 55 years have more problems in learning the local language , Linking Words
while
they have less in finding somewhere to live and making friends.
Regarding adults over 55, they face fewer problems in terms of communicating with people and finding accommodations for living around 22% and just upper 20%, respectively. Meanwhile, the older generation is not capable of learning a new language Linking Words
as well as
their native destination tongue which is approximately 55%.
Linking Words
Group
aged 18-34, as is shown from the graph, have less experience in making a network with people at 45% , followed by looking for accommodation by exactly 40% and they are more experienced in gaining knowledge Add an article
The group
as well as
a new language. Linking Words
Furthermore
, individuals with age 35 to 54 witness the same trend for three categories. Linking Words
Additionally
, they have more ability to find apartments for their stay in their destination country during their work period.Linking Words