
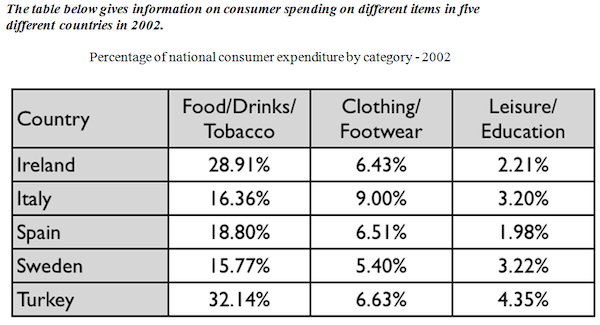
The given table provides information about the percentage of different types of goods (several types of foods, fashion, and leisure or education) consumed by
people
in Ireland, Italy, Spain, Sweden, and Turkey for one year in 2002. In general, the most expenditure was put on Use synonyms
food
items, Use synonyms
while
the lowest was on leisure or education.
Linking Words
To begin
with, The Turkish consumed the most percentage of consumption with 32% of Linking Words
food
/drinks/tobacco, followed by the Irish who spent 28.91% Use synonyms
of
different types of Change preposition
on
food
. Spanish, Italian and Sweden Use synonyms
people
, consumed 18.80%, 16.36%, and 15.77% respectively. Use synonyms
While
Linking Words
,
Remove the comma
apply
people
in those countries expended their money on fashion about three to four times less than Use synonyms
Use synonyms
food
items. Italian spent the biggest percentage of fashion with 9.00%, Change preposition
on food
while
Turkish, Spanish, and Irish consumed 6.63% ,6.51%, Linking Words
6,43
%, and of Correct word choice
and 6,43
Linking Words
this
respectively.
Meanwhile, expenditure on leisure or education things always placed below 5%. Turkish, Sweden Correct pronoun usage
apply
people
, Italian, Irish, and Spanish expended 4.35%, 3.22%, 3.20%, 2.21%, and 1.98% respectively.Use synonyms