
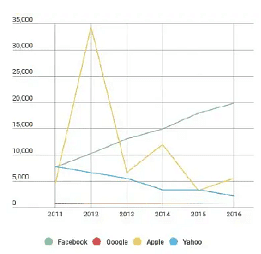
The graph provides statistics about the variation of four different technology companies in terms of stock
prices
in a given period ranging between 2011 and 2016.
Use synonyms
Overall
, it can be seen that Facebook showed a steady increase, Linking Words
while
Yahoo declined. Meanwhile, Apple Linking Words
prices
notably fluctuated, Use synonyms
whereas
Google never changed.
Throughout the 5 Linking Words
years
period, Facebook illustrated a gradual growth of stock Use synonyms
prices
starting from 5000 in 2011 that kept rising by about 2000-5000 each year until it reached 20000 by 2016. Despite starting on a similar footing to Facebook, Yahoo kept decreasing slowly until it went below 5000 in the Use synonyms
last
three Linking Words
years
.
Use synonyms
On the other hand
, Apple demonstrated a wild fluctuation in stock Linking Words
prices
, starting from under 5000 in 2011, which Use synonyms
then
jumped significantly to higher than 30000 in 2012. After that, it dropped dramatically reaching about 7000 in 2013 and stayed changeable between 5000-10000 throughout the rest of the Linking Words
years
. Google did not change with 0 stocks in all Use synonyms
years
.Use synonyms