
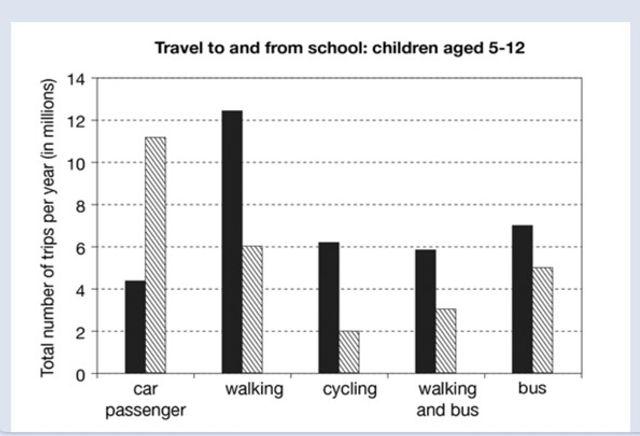
The bar graph illustrates how many
trips
were made by children to travel to and from school using different types of transportation from 1990 to 2010.
Use synonyms
Overall
, the total number of walking was the primary transportation among students between 5 and 12 years old in 1990. The number of car passengers saw the most dramatic increase over two decades and became the primary method of transportation among school children aged 5 to 12 years old.
The total number of car passengers was just above 4 Linking Words
million
Use synonyms
trips
in 1990, exhibiting the least selected option in that Use synonyms
year
. Walking's value was just over 12 Use synonyms
million
Use synonyms
trips
, dominating other options. The remaining methods Use synonyms
that
cycling, walking and Correct word choice
apply
bus
, and only Use synonyms
bus
were just over 6 Use synonyms
million
, just below 6 Use synonyms
million
, and around 7 Use synonyms
million
Use synonyms
trips
per Use synonyms
year
in 1990, respectively.
After two decades, the option of being a car passenger almost tripled its value by roughly 11 Use synonyms
million
Use synonyms
trips
per Use synonyms
year
. The walking method saw a noticeable decrease of more than 6 Use synonyms
million
Use synonyms
trips
per Use synonyms
year
. The least preferred methods were, Use synonyms
therefore
, the remaining alternatives that cycling with approximately 2 Linking Words
million
Use synonyms
trips
, walking and using a Use synonyms
bus
with about 3 Use synonyms
million
Use synonyms
trips
, and Use synonyms
finally
only using a Linking Words
bus
with around 5 Use synonyms
million
Use synonyms
trips
.Use synonyms