The chart below shows the changes that took place in three different areas of crime in Newport city center from 2003-2012. Summarise the information by selecting and reporting the main features and make comparisons where relevant.

The chart below shows the changes that took place in three different areas of crime in Newport city center from 2003-2012. 

Summarise the information by selecting and reporting the main features and make comparisons where relevant.
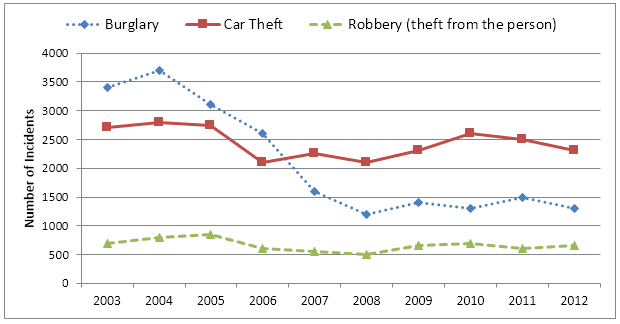
The line chart gives information about crime in three different places in Newport city centre between 2003 and 2012. A period of nine years.
Overall
, it can be seen that there are three types of crime burglary, car theft and Robbery.
In addition
, the percentage of the three types declined from 2003 to 2012.
To begin
with, the proportion of burglaries sharply declined from 2004 to 2008 about 3,000. But, the number was stable at about 1,500.
Moreover
, the total of car theft was 2,300 to 2,5000 between 2003 and 2005 ,anyway the number was highly down from 2005 to 2006 from 2,700 to about 2,1000. And
then
the percentage was stable. For robbery, the total was not more than 600 and from 2003 to 2012 or a period of nine years the proportion was stable.
Submitted by itchayatop31 on

Unauthorized use and/or duplication of this material without express and written permission from this site’s author and/or owner is strictly prohibited. Excerpts and links may be used, provided that full and clear credit is given to Writing9 with appropriate and specific direction to the original content.

Common mistake: Your writing should be 150-250 words.
Vocabulary: The word "percentage" was used 2 times.
Vocabulary: The word "proportion" was used 2 times.
Vocabulary: The word "declined" was used 2 times.
Vocabulary: The word "stable" was used 3 times.
Vocabulary: The word "about" was used 4 times.
What to do next:
Look at other essays: