
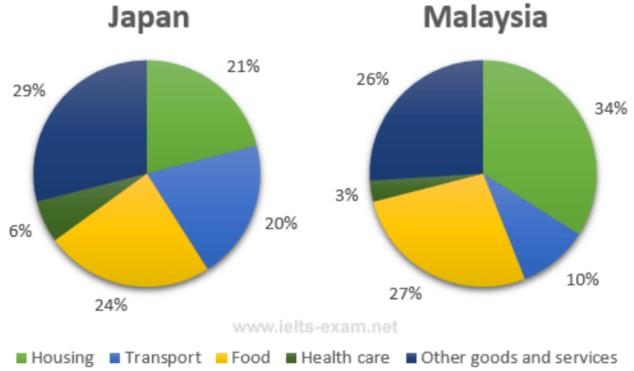
The pie charts illustrate the percentages of household expenditures in six distinct categories in
Japan
and Use synonyms
Malaysia
in 2010.
Use synonyms
Overall
, it is evident that housing costs made up the most in Linking Words
Malaysia
, Use synonyms
while
the Japanese spent most on other goods and services. Linking Words
In addition
, both countries spent the least on healthcare.
Regarding the residence sector, its expenditure accounted for 34% in Linking Words
Malaysia
, Use synonyms
while
the Japanese spent much less than Malaysians, with 21% of the total. Linking Words
In contrast
, Linking Words
Japan
's spending on 'the others' group reported the highest proportion of 29%, followed by 24% of expense on food. Use synonyms
Similarly
, the counterparts for Linking Words
Malaysia
recorded more or less the same figures as Use synonyms
Japan
, with 26% and 27%, respectively.
Use synonyms
However
, the stark contrast was demonstrated in the transport and healthcare category. The figures for Linking Words
Japan
exactly doubled those of Use synonyms
Malaysia
; each comprised 20% and 6% of the total in Use synonyms
Japan
, Use synonyms
whereas
only 10% and 3% in Linking Words
Malaysia
, respectively.Use synonyms