
The bar chart and line graph illustrate the monthly expenditures of an American family in
dollars
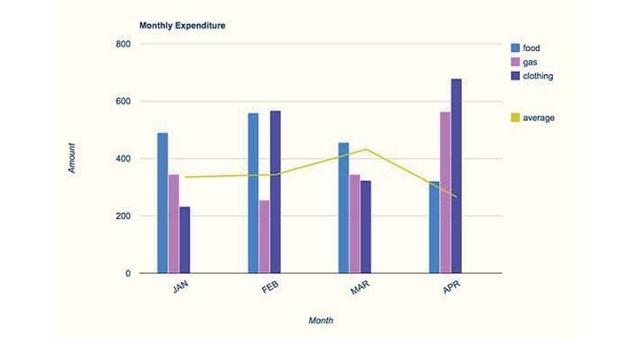
on three different categories, which are food, gas and clothing, and their averages from January to April in the year 2010.
Use synonyms
Overall
, it is noticeable that expenditure on food is almost high in every month except for April and the average of all the spending is about 425 Linking Words
dollars
during March, which implies that their expenditure is high during Use synonyms
this
time.
It is evident that the family spent around 300 Linking Words
dollars
on their necessities. The expenses on food increased from January to February but decreased Use synonyms
thereafter
. The expenses on clothing spiked once in two months and it was about $550 in February and $675 in April.
Linking Words
However
, the expenditure on gas never once exceeded other spending. Linking Words
Moreover
, expenses over Linking Words
this
remained below 350 Linking Words
dollars
every time except for April, which was almost $550.Use synonyms