
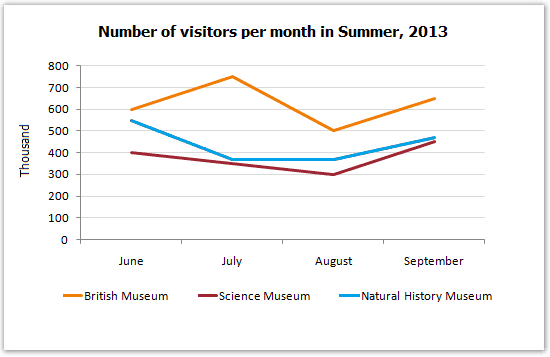
The line graph shows detailed data about how many numbers of people visited three different museums from Jule to September 2013.
Admittedly, it is evident that one of the most popular and historical which was "the British Museum"became the leader during the four months.
Moreover
, it is Linking Words
also
worth noting that the number of people who came to both museums were Science and Natural History.
In detail, the figure for the British
The museum increased slightly to approximately 750 in July,afterwards, there was a negligible going down to 500 in August. Linking Words
For instance
, it went up to around 700 in September.
Plausible as Linking Words
this
seems, both figures are almost similar, the trend which was the Natural History saw a noticeable plunge to roughly 400. Linking Words
However
, the rating of the Science Museum decreased to 300 in August. Linking Words
Last
but not least, the two numerals virtually rose the same share to 450.Linking Words