
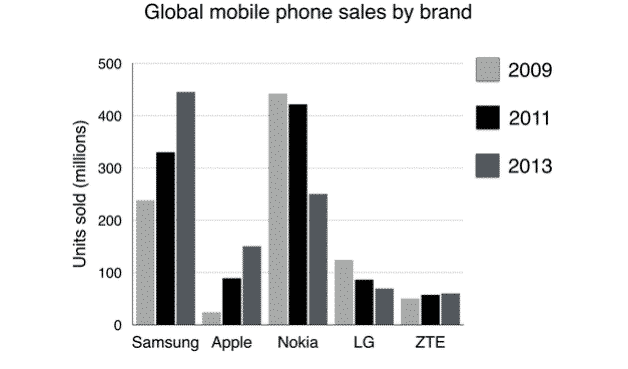
The pie chart illustrates the amount of money earned by selling products in the five well-known companies including Samsung, Apple,
Nokia
, LG and ZTLE from 2009 to 2013.
Use synonyms
Overall
, Linking Words
Nokia
accounted for the most popular brand over the period shown Use synonyms
while
Linking Words
ZTE
Use synonyms
sales
were the lowest among others. Use synonyms
Nokia
had earned the highest amount of money until 2011, Use synonyms
whereas
Apple and Linking Words
ZTE
had the least number of customers. Use synonyms
Similarly
, Linking Words
ZTE
Use synonyms
sales
were the least in 2013 as opposed to LG.
In terms of the Samsung brand, in 20013 it became the most popular company (with around 450 Use synonyms
million
Use synonyms
sales
). In 2009, Use synonyms
Nokia
's Use synonyms
sales
were the highest at approximately 450 Use synonyms
million
. Despite the minimal decrease of 10 Use synonyms
million
in 2013, it was still the most popular.
Use synonyms
On the other hand
, Apple accounted for the lowest Linking Words
sales
in 2009. Use synonyms
Although
Linking Words
ZTE
's Use synonyms
sales
were the lowest in 2011 at 50 Use synonyms
million
and its popularity remained constant in 20013, there was a marginal increase of less than 1 Use synonyms
million
.Use synonyms